High-Performance Open-Source Archive
![]()
![]()
The goal of tidycharts is to enable R users to create charts inspired by International Business Communication Standards (IBCS). The plots are generated in SVG format, so embedding them in HTML documents is straight forward.
You can install the released version of tidycharts from CRAN with:
install.packages("tidycharts")Development version from GitHub can be installed with:
devtools::install_github("MI2DataLab/tidycharts")How to create IBCS inspired charts using tidycharts?
library(tidycharts) # load the package

# create some data to visualize
df <- data.frame(months = month.abb[1:6],
                 values = round(5 + sin(1:6), 2))

# create chart in a form of character vector containing SVG content
column_chart(df, x = 'months', series = 'values')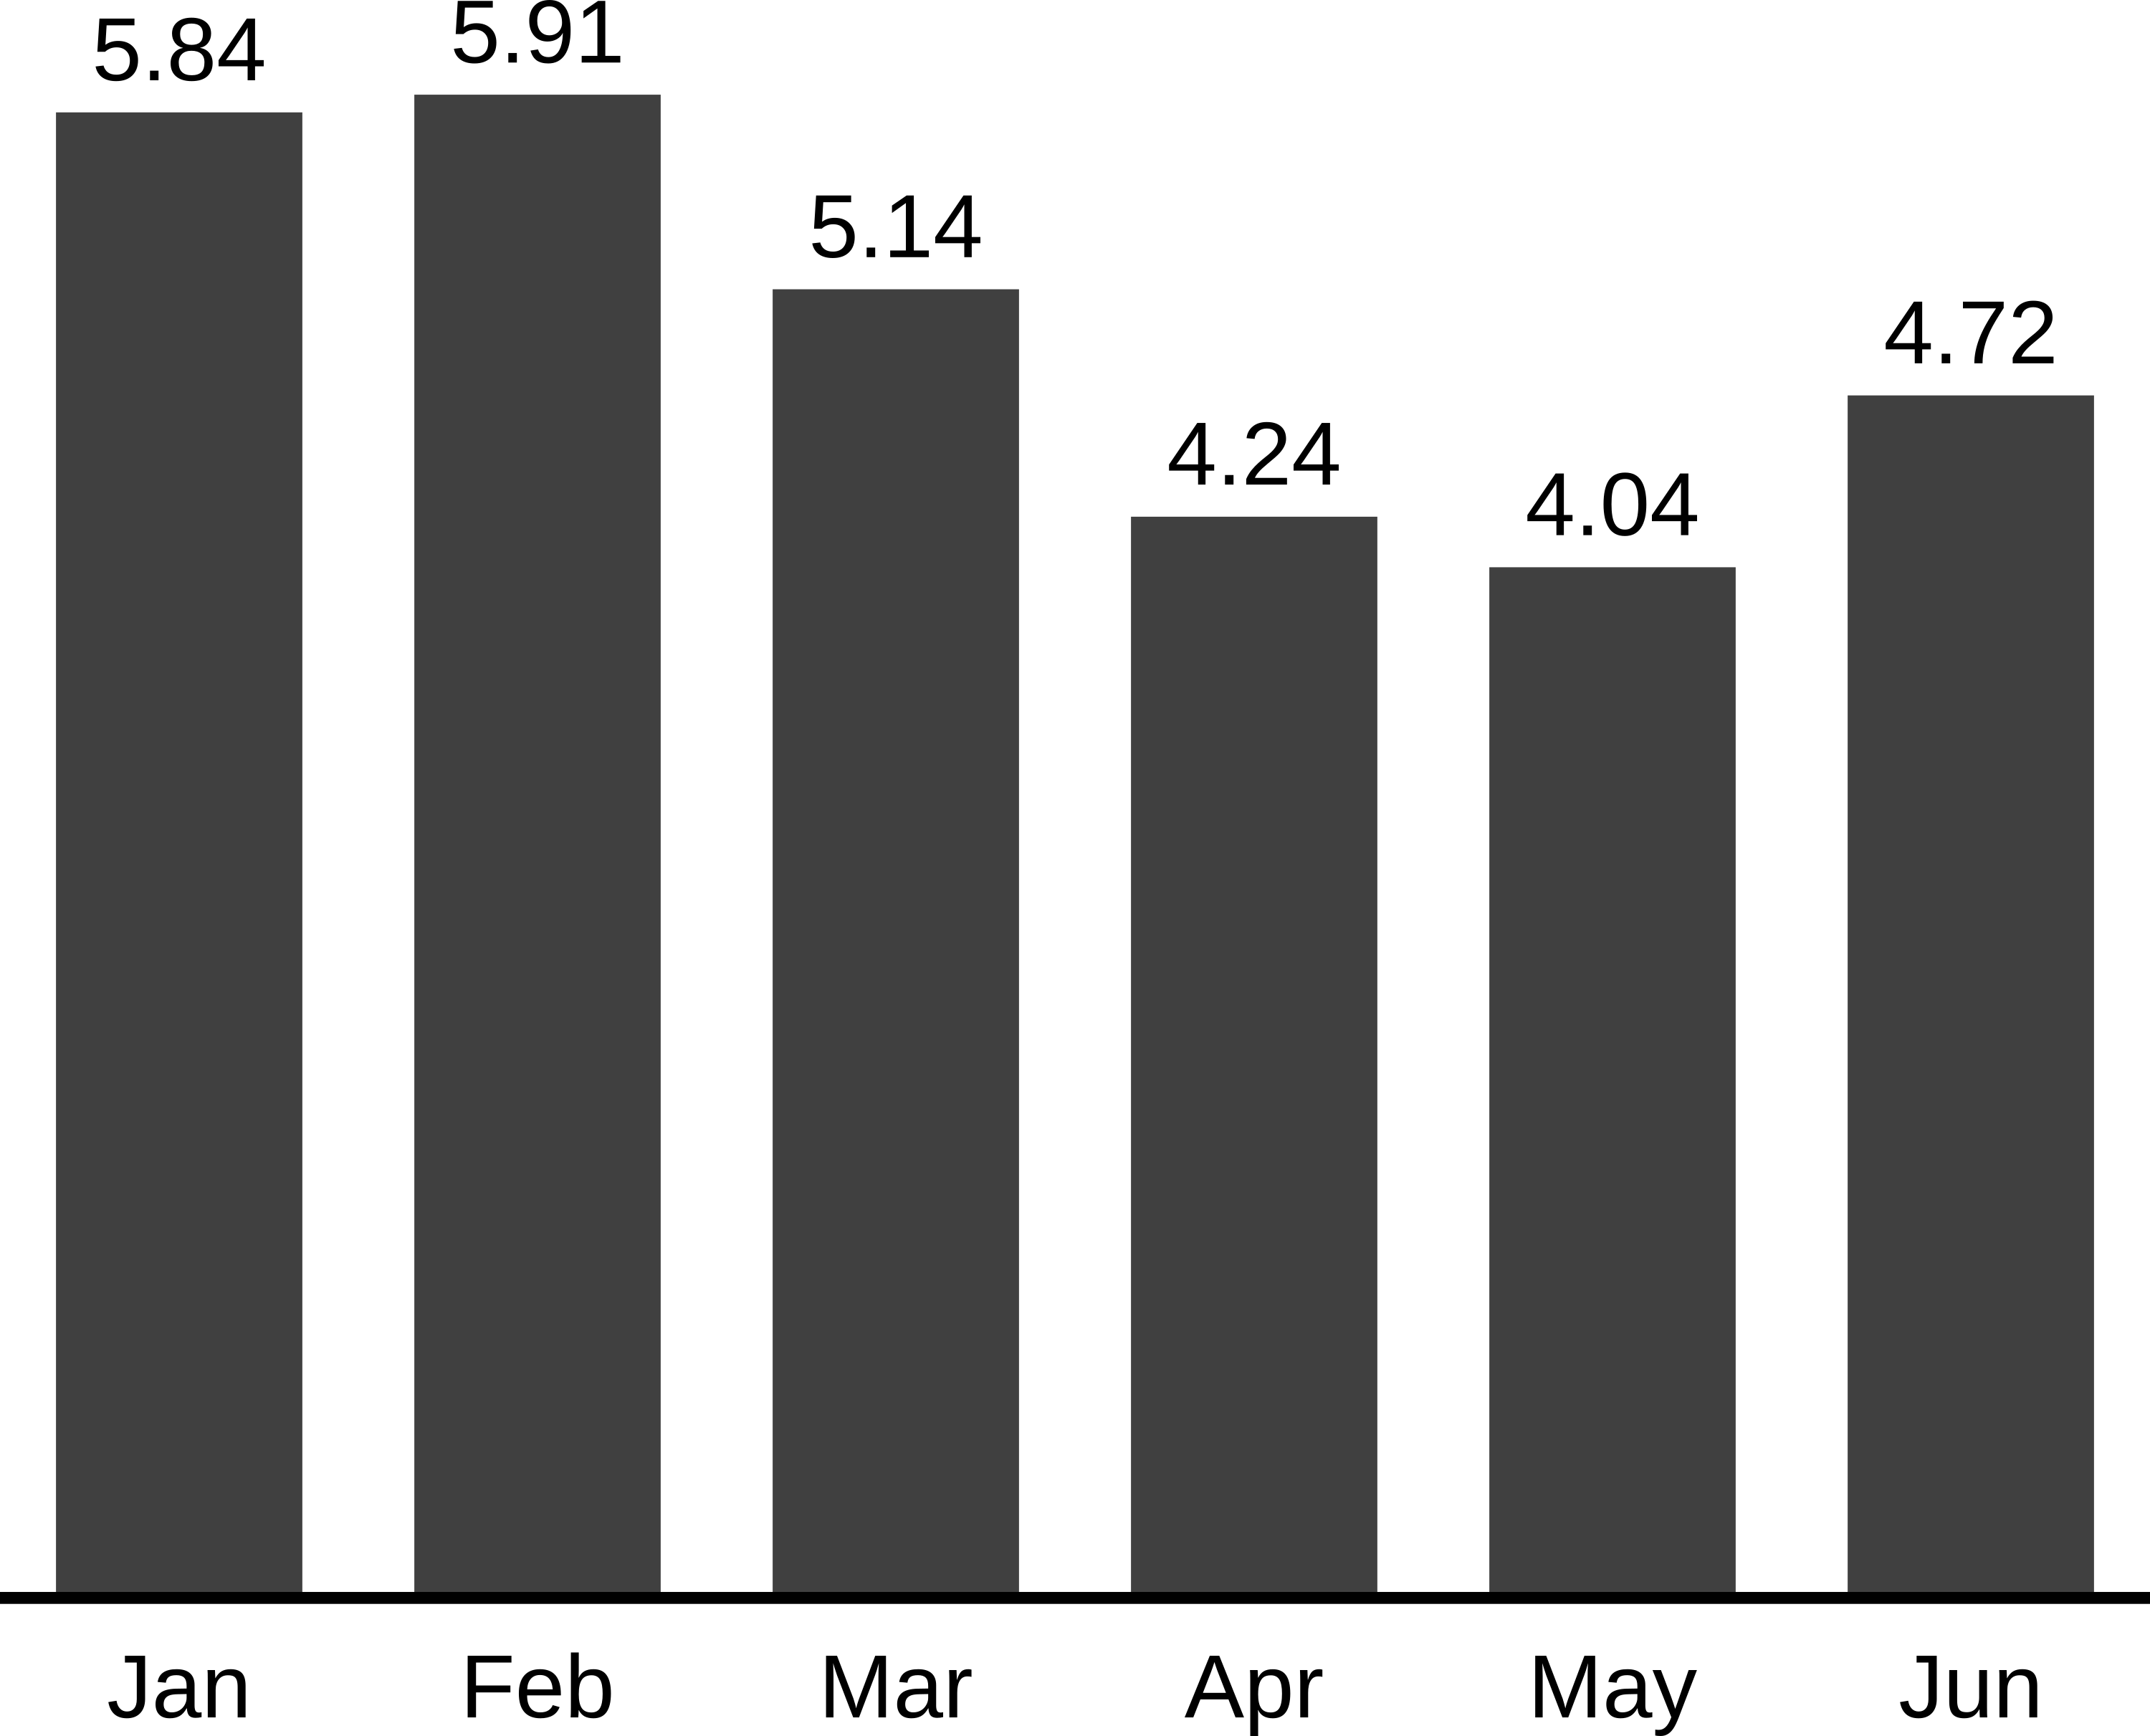
You can easily create other type of plots, ie. lineplots:
line_chart_markers(df, x = df$months, series = 'values', series_labels = 'values')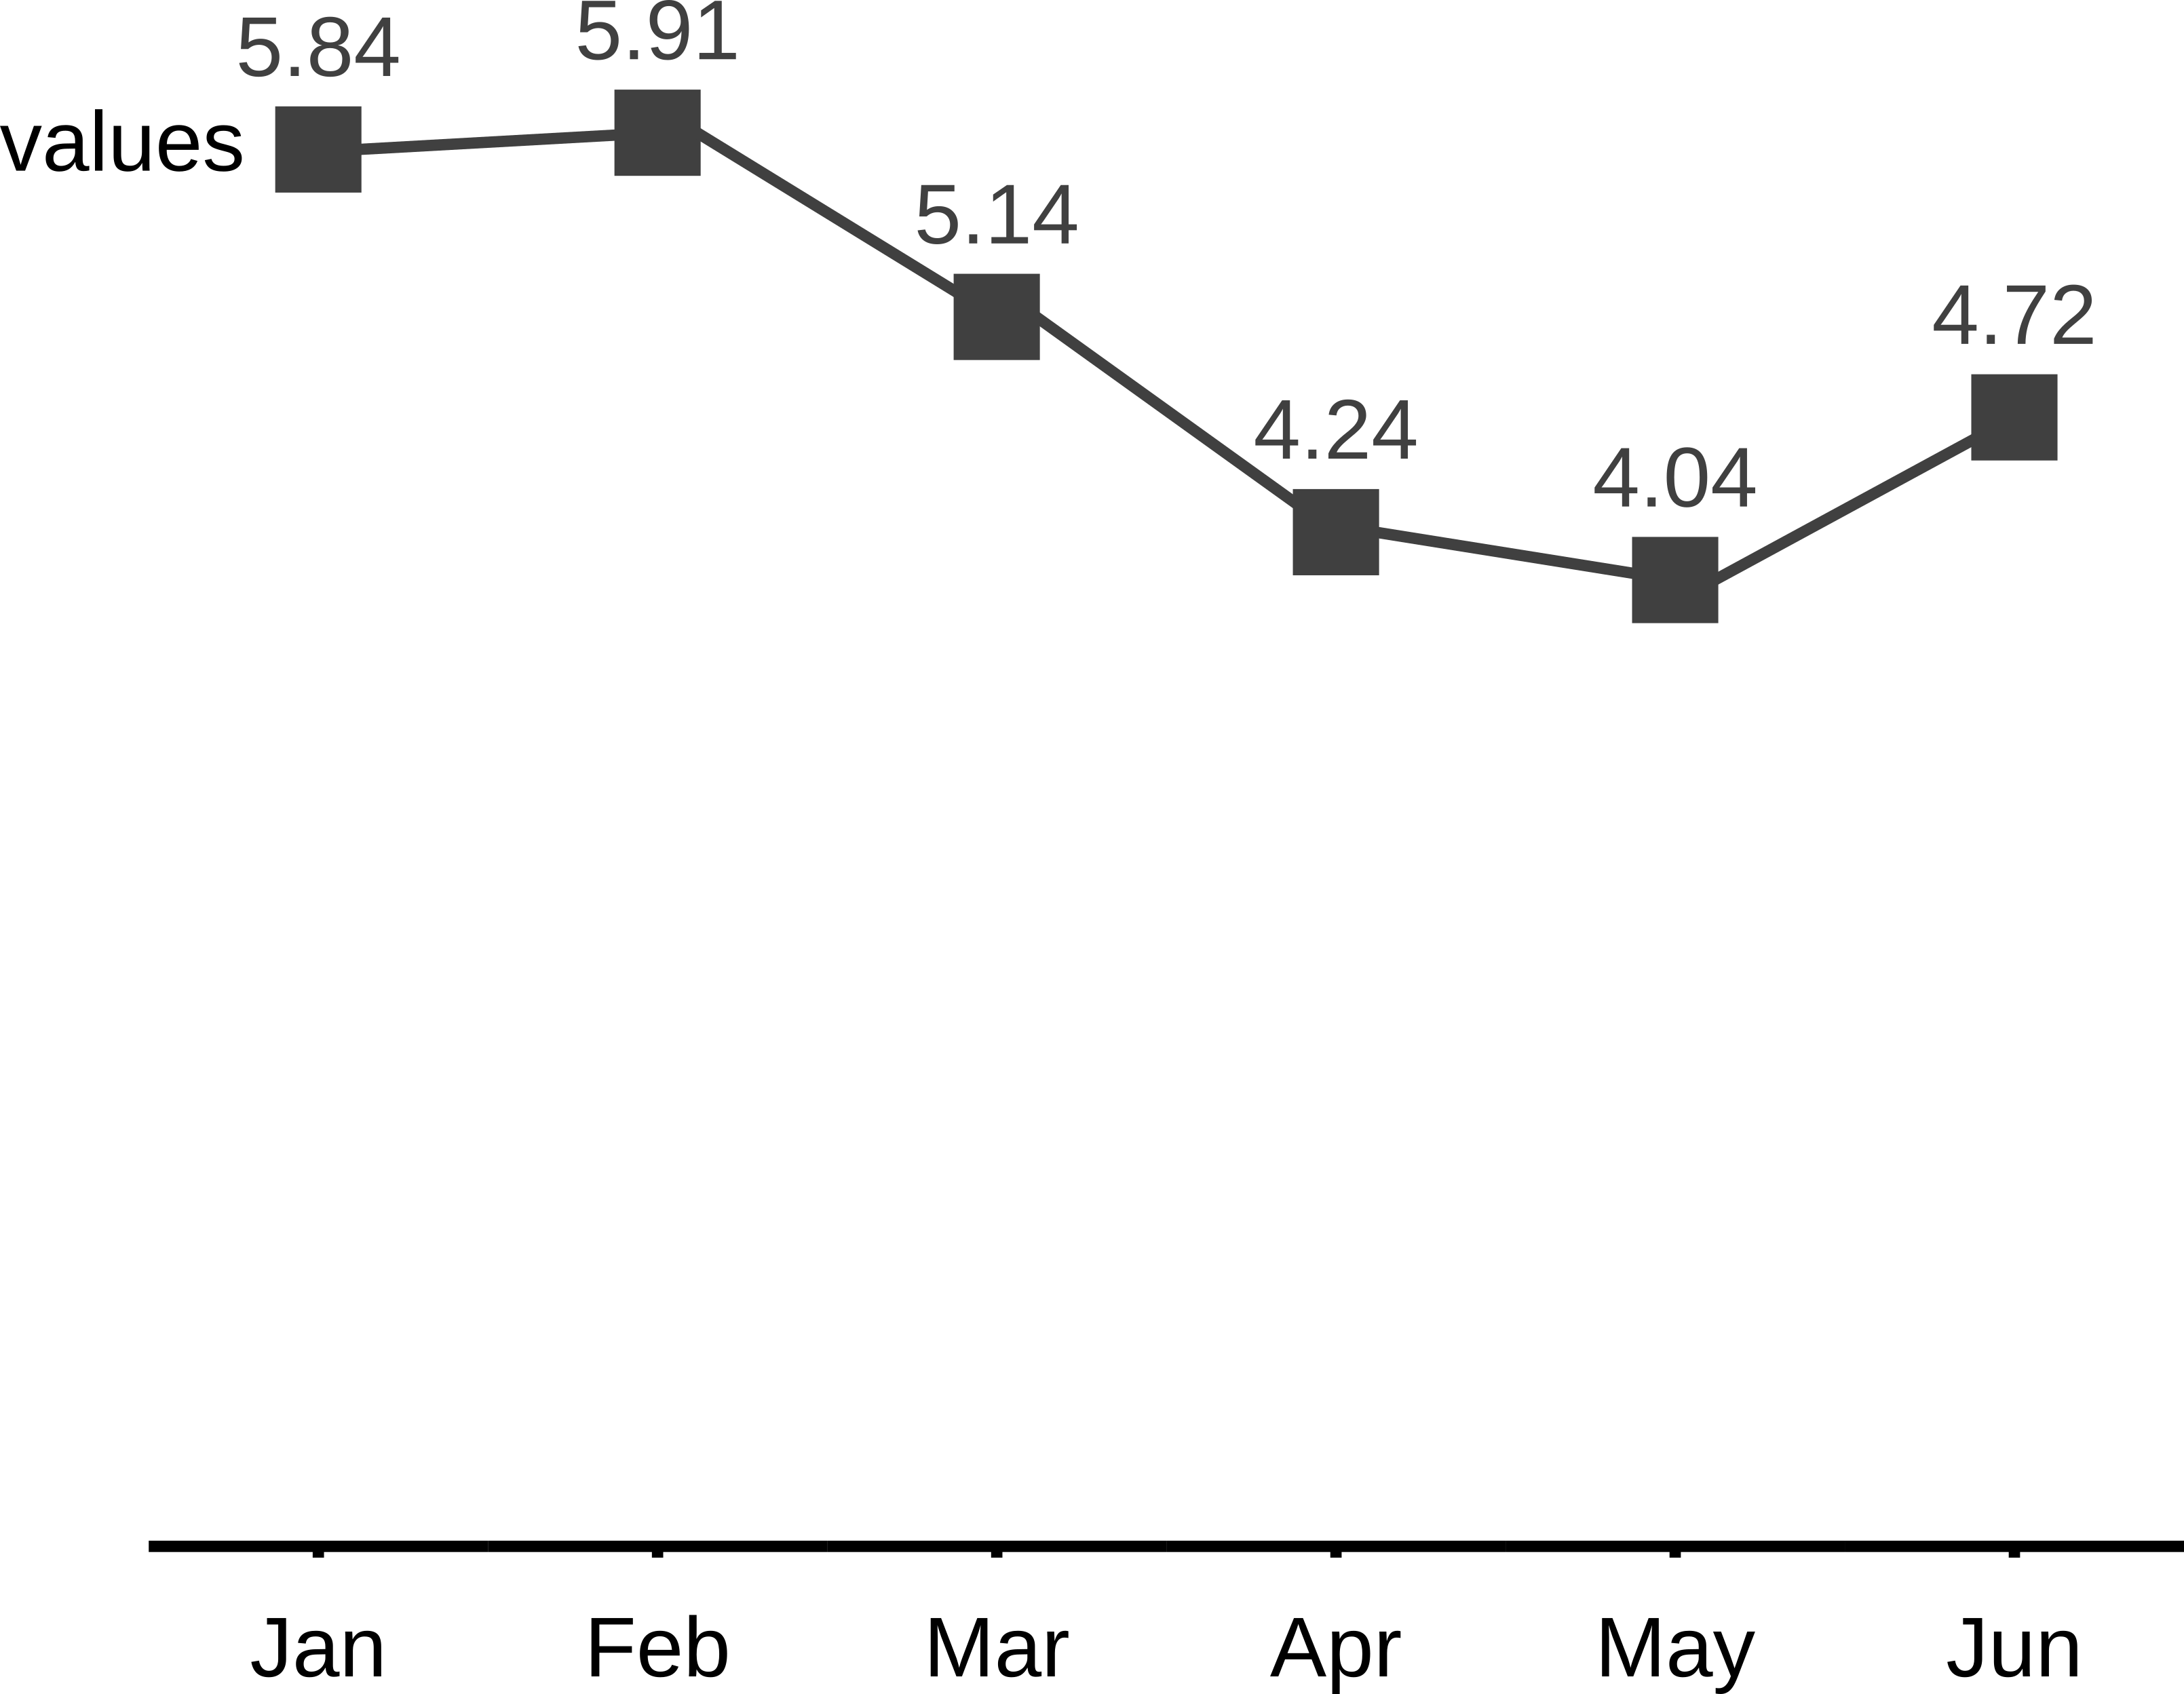
Need mirroring services?
Contact our team at info@vpspulse.com.
Mirror powered by VPSpulse
Infrastructure sponsored by VPSPulse & Secure Payments by ArionPay.