High-Performance Open-Source Archive
![]()
![]()
The goal of fftab is to make working with fft’s in R
easier and more consistent. It follows the tidy philosophy by working
with tabular data rather than lists, vectors, and so on. Typical signal
processing operations can thus often be accomplished in a single
dplyr::mutate call or by a call to similar functions. Some
examples are shown here.
You can install the development version of fftab from GitHub with:
# install.packages("pak")
pak::pak("thk686/fftab")Using fftab with ggplot.
fftab(sunspot.month, norm = TRUE) |>
  to_rect(.keep = "all") |>
  to_polr(.keep = "all") |>
  print(n = 5) ->
ssm.fft
#> # A tibble: 3,177 × 6
#>    .dim_1 fx              re     im   mod    arg
#>     <dbl> <cpl>        <dbl>  <dbl> <dbl>  <dbl>
#> 1 0       51.96+0.00i 52.0    0     52.0   0
#> 2 0.00378  4.37+4.99i  4.37   4.99   6.63  0.852
#> 3 0.00755 -0.86+5.08i -0.860  5.08   5.15  1.74
#> 4 0.0113  -2.65-5.70i -2.65  -5.70   6.29 -2.01
#> 5 0.0151  -4.64-0.59i -4.64  -0.586  4.68 -3.02
#> # ℹ 3,172 more rowsggplot(fortify(sunspot.month)) +
geom_line(aes(x = Index, y = Data)) +
ylab("Sunspot count") +
xlab("Year") +
theme_bw() ->
p1
xlocs <- c(1, 0.1, 0.01)
xlabs <- c("1", "10", "100")
ssm.fft |>
dplyr::filter(.dim_1 > 0) |>
ggplot() +
geom_point(aes(x = .dim_1, y = mod)) +
geom_smooth(aes(x = .dim_1, y = mod)) +
scale_y_continuous(trans = "log", labels = function(y) signif(y, 1)) +
scale_x_continuous(trans = "log", breaks = xlocs, labels = xlabs) +
xlab("Cycle duration (years)") +
ylab("Mean amplitude") +
theme_bw() ->
p2
print(p1 / p2)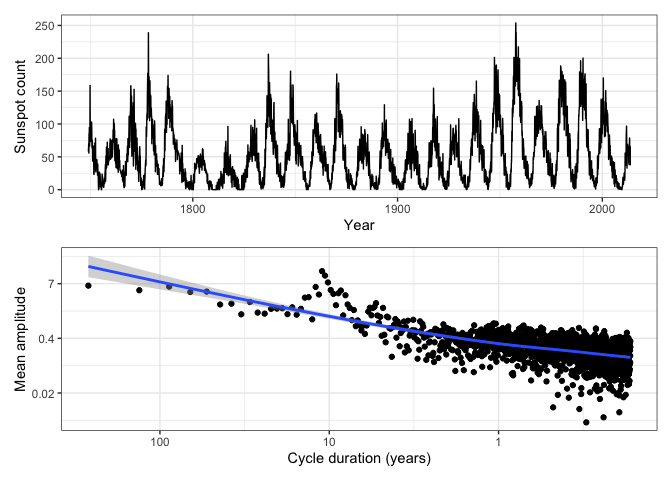
Need mirroring services?
Contact our team at info@vpspulse.com.
Mirror powered by VPSpulse
Infrastructure sponsored by VPSPulse & Secure Payments by ArionPay.