High-Performance Open-Source Archive
![]()
An R package to assess calibration of binary outcome predictions. Authored by Timo Dimitriadis (Heidelberg University), Alexander Henzi (University of Bern), and Marius Puke (University of Hohenheim).
The most current version is available from GitHub.
# install.packages("devtools")
devtools::install_github("marius-cp/calibrationband")library(calibrationband)
library(dplyr)
set.seed(123)
s=.8
n=10000
x <- runif(n)
p <- function(x,s){p = 1/(1+((1/x*(1-x))^(s+1)));return(p)}
dat <- tibble::tibble(pr=x, s=s, cep = p(pr,s), y=rbinom(n,1,cep))%>% dplyr::arrange(pr)
cb <- calibration_bands(x=dat$pr, y=dat$y,alpha=0.05, method = "round", digits = 3)
print(cb) # prints autoplot and summary, see also autoplot(.) and summary(.)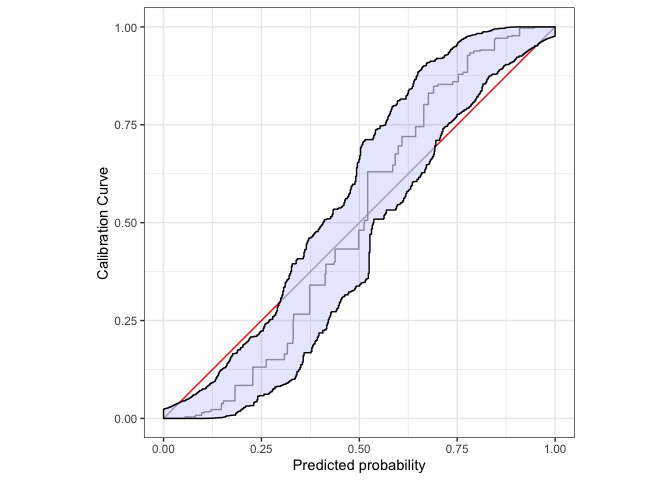
#> Areas of misscalibration (ordered by length). In addition there are 1 more.
#> # A tibble: 4 × 2
#>    min_x max_x
#>    <dbl> <dbl>
#> 1 0.0396 0.299
#> 2 0.693  0.951
#> 3 0.957  0.957
#> # … with 1 more row
Use ggplot2:autolayer to customize the plot.
autoplot(cb,approx.equi=500, cut.bands = F,p_isoreg = NA,p_ribbon = NA,p_diag = NA)+
ggplot2::autolayer(
cb,
cut.bands = F,
p_diag = list(low = "green", high = "red", guide = "none", limits=c(0,1)),
p_isoreg = list(linetype = "dashed"),
p_ribbon = list(alpha = .1, fill = "red", colour = "purple")
)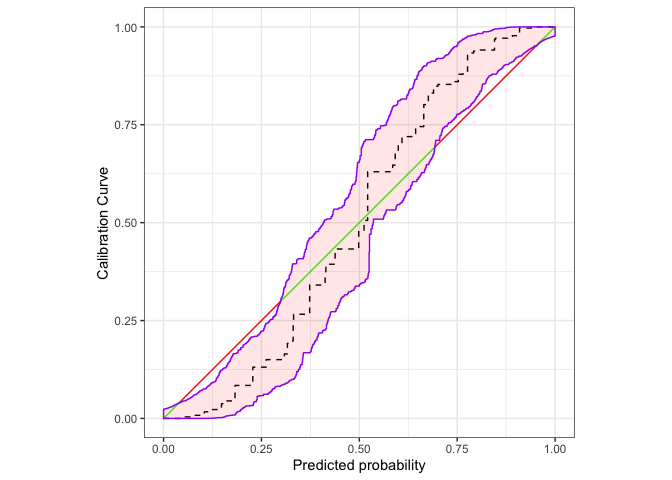 ```
```
Need mirroring services?
Contact our team at info@vpspulse.com.
Mirror powered by VPSpulse
Infrastructure sponsored by VPSPulse & Secure Payments by ArionPay.